

May 2026 – The Economic Impact of Data Centers in your Community: Power or Poison?

Data centers have become one of the most highly charged topics in communities across the country. From one perspective, there’s a need for data centers as our technology use increases and AI continues to advance. From another, residents are seeing increases in energy prices and are increasingly worried about not having enough water to support all the demands within their communities. Some argue that the large environmental impacts outweigh the economic benefits, but the prospect of bringing new jobs and tax money into the region is enticing to others. Caught in the middle of these competing pressures, local leaders face the unenviable task of making decisions that are rarely simple and almost always controversial in the eyes of one group or another.

While we can’t cover all these topics in one short newsletter, we’ve put together an impacts comparison to demonstrate how these data centers stack up when compared to other industries that could exist in similar locations.

Economic Impact Comparison of Data Centers to Other Industries

Communities can be drawn to data centers for many different reasons. To demonstrate some of these reasons, we selected three different land-use categories for comparison, as cities and counties typically have control over broad zoning classifications such as industrial, commercial, and residential. The three options selected include agriculture, health care, and manufacturing.[1]

This comparison will also walk through several different “levels” of economic impact. This will illustrate how one could arrive at different answers depending on how deep a dive is taken into the analysis. We have also taken care to make these comparisons apples-to-apples in terms of magnitude. Recently many data center developments have ventured into “mega” territory, with facilities encompassing hundreds of thousands of square feet (SF). However, it would not make for a fair comparison to weigh a 1.2 million SF Data Center against a more standard 75K SF manufacturing facility.

The three economic impact “levels” we settled on for the economic impacts comparison include:

  1. Tax impacts (Basic): Property, personal property, and sales/use taxes only
  2. Direct Impacts: Direct effects in terms of jobs, earnings, and sales
  3. Total Impacts: Direct effects plus multiplier effects (direct and indirect)[2]

Economic Impact Analysis (EIA) Comparison Inputs: Location & Industry Types

Economic impact findings can vary greatly based on the location of the study. To provide comparisons that are not biased in any one direction, the first challenge was to identify an area that is “average” in as many ways as possible and that also has sufficient economic diversity to make the land-use comparisons realistic. In other words, the type of place that a data center may end up located but that does not currently have one. Ultimately, we landed on Ellis County (TX), which is part of the Dallas-Fort Worth MSA. This location is neither completely urban nor completely rural. It contains farms, open space, hospitals, and some industrial diversity.

Oftentimes modern “mega” data centers can be upwards of 1 million SF and use over 100 MW of power, but comparing a mega data center to a typical hospital or manufacturing facility would result in an unequal comparison. Therefore, we assumed a more average sized data center of roughly 220K Sf (referred to as “Average Data Center”). Within Ellis County, we identified three existing businesses operating at typical size and production scales to compare against the simulated Data Center scenario. Each site’s acreage and facility square footage were scaled, as appropriate, to match an Average Data Center.

Lastly, we offer one important caveat regarding these results. Not every state has the same tax structure as Texas. To compensate for the absence of a state-level income tax, Texas is known for having above-average property taxes.[3] In addition, at least 12 states impose no tangible personal property (TPP) tax at all.[4] In general, states have developed their tax regimes to ensure they are not operating at significant deficits or overly dependent on federal subsidies. However, depending on the industry type, differences in tax structure may result in higher or lower tax impacts within specific categories.

Tax Impacts

For the total tax impact comparison, PC simulated the development of each of the four land-use categories. Specifically, our team analyzed the total real estate, tangible personal property, and sales taxes that would have been generated if these developments were completed within two years and operated for an additional 13 years.[5]

"Our team analyzed the total real estate, tangible personal property, and sales taxes that would have been generated if these developments were completed within two years and operated for an additional 13 years."

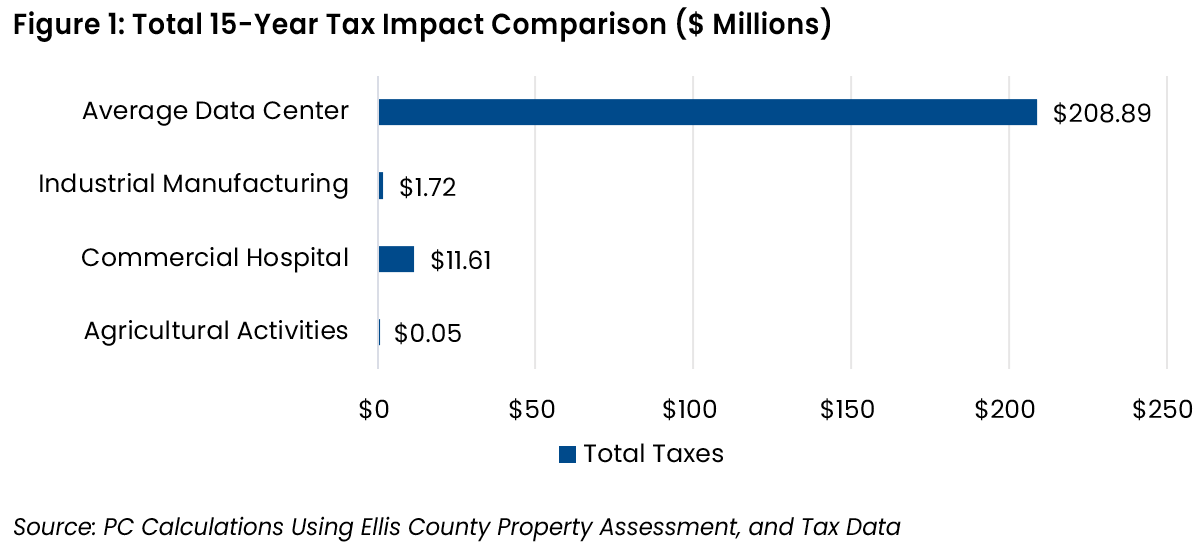
When examining the 15-year tax impact comparisons (Figure 1), the relative attractiveness of a Data Center development becomes apparent. By our calculations, an Average Data Center would produce 120 times the tax revenue of a manufacturing facility, and 18 times the tax revenue of a hospital.

Not included in these calculations, but also important to note, is that Data Centers have a refresh cycle where servers and hardware generally must be replaced every 2-5 years. For

states heavily dependent on sales and use tax, those replacements trigger a repeated round of revenue.[6]

Direct Impacts

To produce the direct effects by industry type, the team gathered employment data for each development to serve as the primary input.[7] Once appropriately scaled, each employment estimate was run through the Bureau of Economic Analysis (BEA) RIMS II EIA model to produce annual economic impacts.

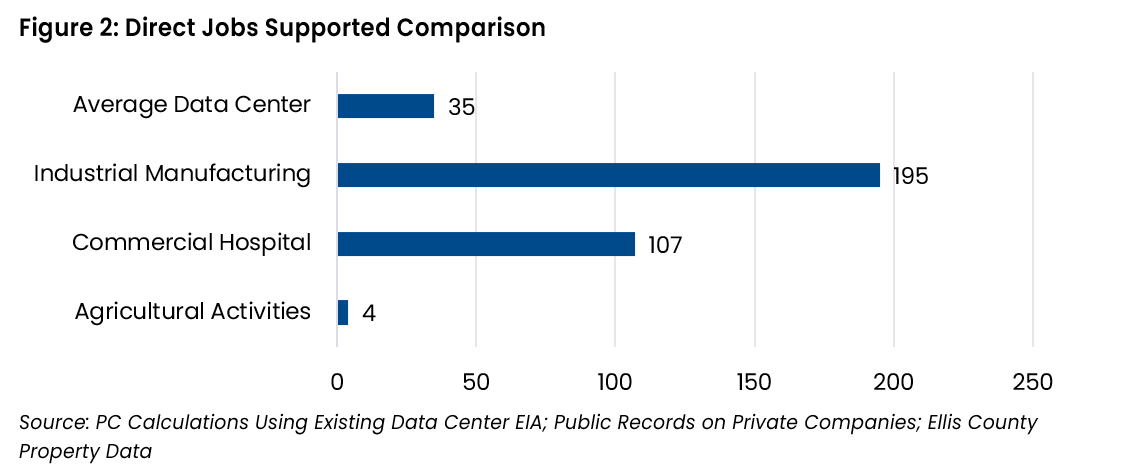
Figure 2 illustrates the differences in direct employment levels across each type of development. These findings represent the first metric that many community members and economic development professionals consider when assessing the full economic impact of a project in their region.

An Average Data Center is expected to support around 35 direct jobs. However, due to differences in labor intensity by industry, a manufacturing facility of comparable size is estimated to support 195 direct jobs. This is nearly six times the number of direct jobs supported by an Average Data Center (even accounting for the scale difference). We also expect a hospital to support roughly three times as many jobs as an Average Data Center.
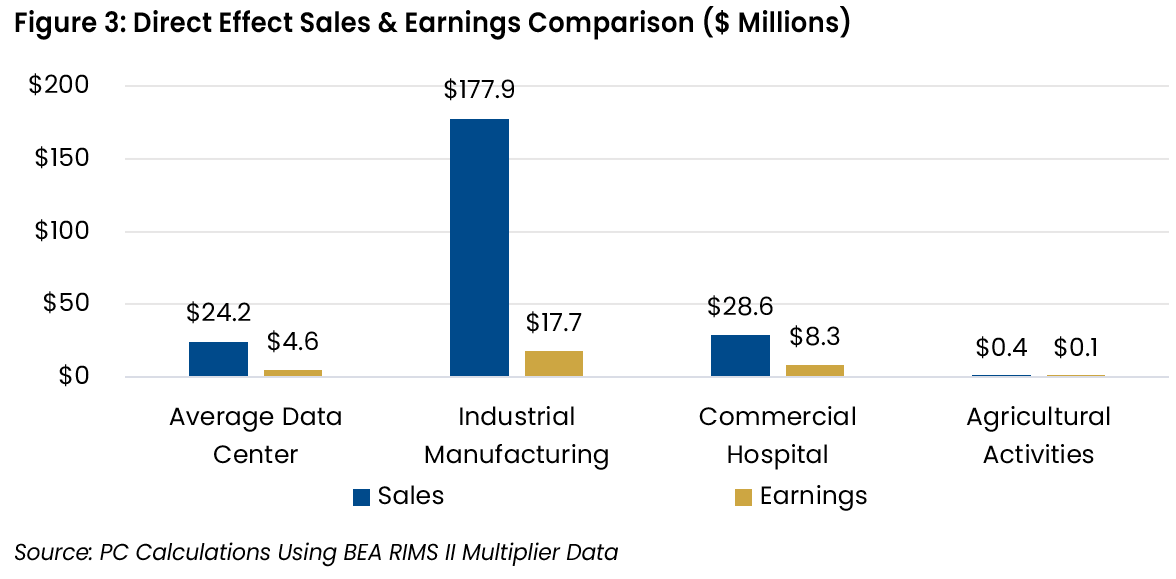
Using the BEA’s EIA model, PC estimated the direct economic output (sales) and earnings for each development type. An Average Data Center is expected to produce $24 million annually in sales (Figure 3). In contrast, we estimate a manufacturing facility to generate $178 million. This is seven times the output of a Data Center. Similarly, we project a typical hospital to outproduce an Average Data Center, generating $29 million in output.

The results for earnings are similar. A manufacturing facility is expected to outproduce the Data Center in economic output and earnings, though the gap for earnings is smaller.
Total Impacts

At the total impact level, additional multiplier effects are taken into account. Specifically, these include the additional economic impacts generated for other businesses in the region by a Data Center, manufacturing facility, or hospital.

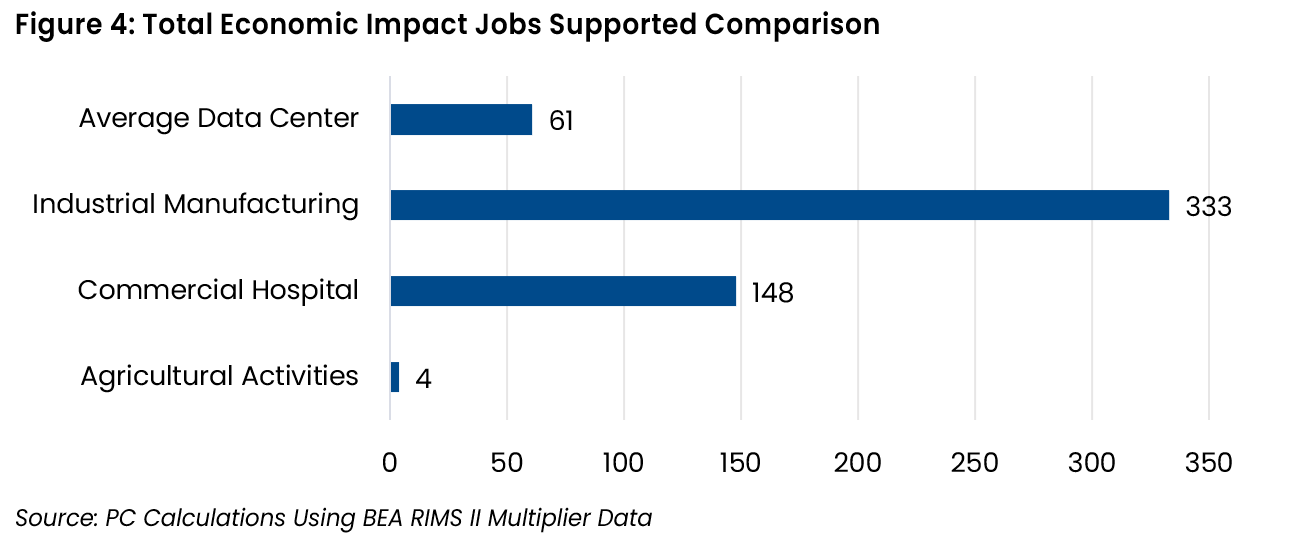
After accounting for multiplier effects, the final results do not change substantially. Manufacturing and health care still produce greater overall economic impacts than a Data Center when looking beyond total tax impacts. Using the direct jobs estimates (Figure 2) and the direct effects jobs multipliers (Figure 6), we reached the conclusions presented in Figure 4.

For an Average Data Center, the 35 direct jobs supported result in 61 total jobs supported at the direct and indirect levels (26 additional jobs through indirect effects). In manufacturing, we estimate 333 total jobs to be supported (138 additional jobs through indirect effects). We estimate health care to also support more jobs than an Average Data Center, including indirect effects, at 148 jobs.
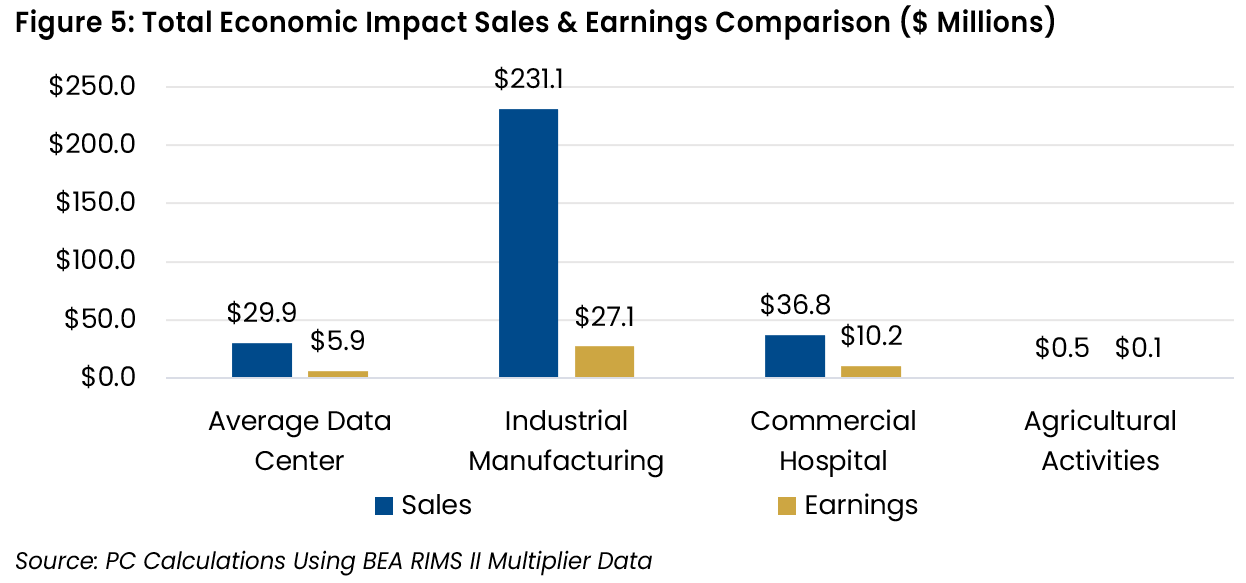
In terms of sales, we expect manufacturing and hospitals to outproduce Data Centers, as shown in Figure 5. In total, we estimate an Average Data Center to generate $30 million in sales, adding about $5 million to the direct effects, compared to $231 million for a manufacturing facility (including $53 million added to direct effects) and $37 million for a commercial hospital. We also expect an Average Data Center to generate less earnings than manufacturing or hospitals at this level.
 

Multiplier Effects

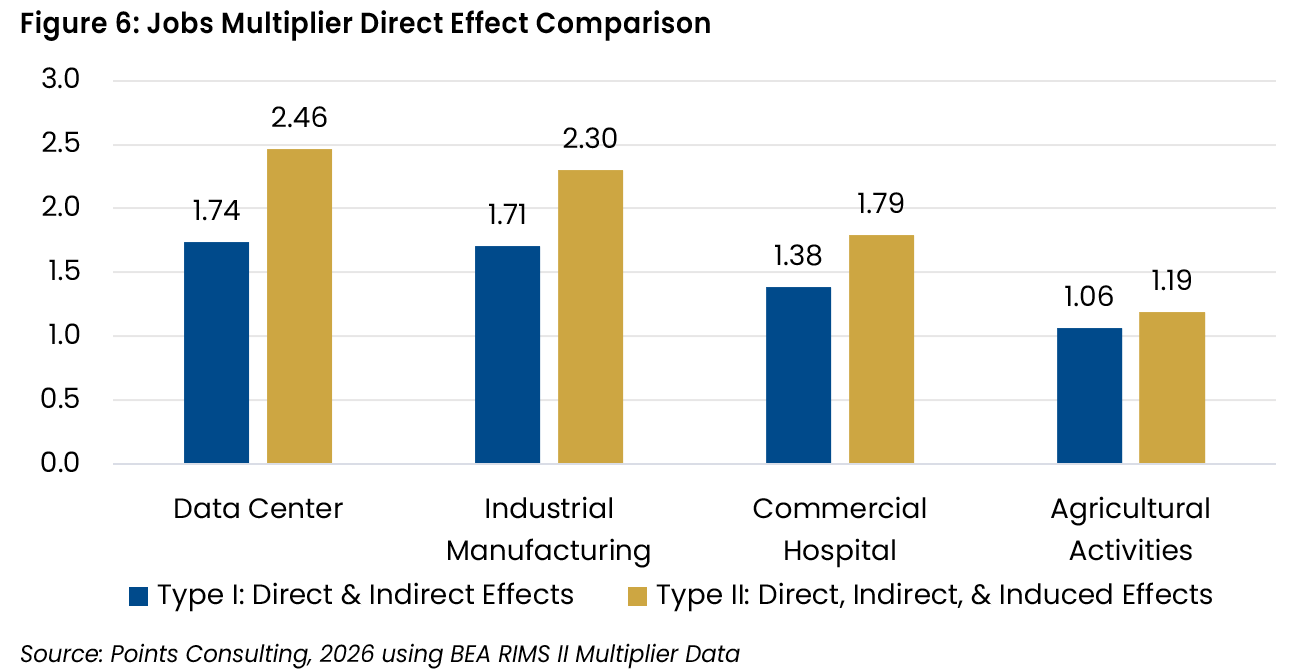
Figure 6 reports the direct effect jobs multipliers for each industry. These multipliers reflect the additional jobs supported across all other industries in the region. Using these multipliers, PC was able to estimate the direct results for output (sales) and earnings. As shown by the multipliers in Figure 6, a Data Center development produces the largest multiplier effects. To be specific, each direct job created by a Data Center supports an additional 1.74 jobs at the Type I level in the local economy (Ellis County in this case), compared to 1.71 for manufacturing, and 1.38 for health care.
In terms of what development to encourage in your community, there is no one size fits all answer. Every new development and industry comes with its own set of pros and cons. In the end, the most important thing is to do your homework to understand what those pros and cons are because it’s much easier to mitigate the cons if there’s a plan in place from the get-go.
PC News

Recently Completed Projects

Fort Myers Athletic Center Feasibility Study, Card & Associates Athletic Facilities, Fort Myers (FL)

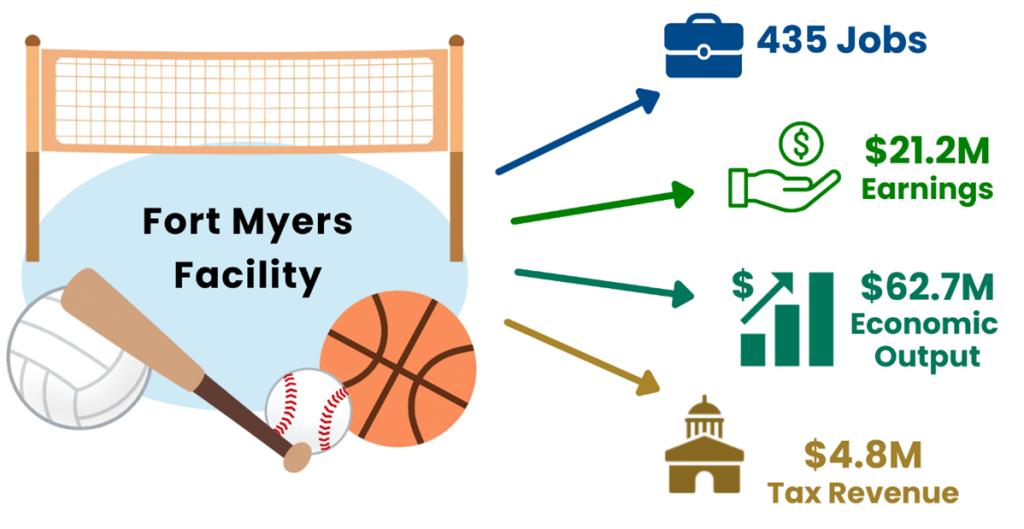
Our team conducted a feasibility and economic impact analysis for a proposed athletic facility within the Fort Myers/Cape Coral, Florida area. The Facility would be developed by Card & Associates, which operates several similar facilities throughout the country. Based on all research conducted for this study, PC concludes that the Fort Myers area would greatly benefit socioeconomically from the proposed Facility and would experience no notable drawbacks. The annual economic impact of the Facility is projected to reach $62.7 million once fully operational. Though certain facilities in the area provide access to sports amenities, the area is in need of additional facilities (particularly indoor ones) to allow for year-round use. The Facility would serve as a nexus for a wide variety of sports activities and is expected to draw visitors from a broad market rather than rely solely on local populations.

Impact Fee Consulting, Idaho Falls (ID)

PC president Brian Points assessed the legality of City of Idaho Falls’ impact fee regulations.

New & Ongoing Projects

New! Strategic Business Plan, Port of Hood River (OR)

New! Meat Processing Facility Feasibility Study, Kaibab Tribe of Paiute Indians (AZ)

New! Community-Level Housing Market Study Services, State of Tennessee Department of Economic & Community Development (TNECD)

Cochise County Continuing Care Retirement Community (CCRC) Feasibility Study, Copper Queen Community Hospital Foundation (AZ)

Housing Action Plan, City of Ridgway (CO)

Medical University of South Carolina (MUSC) Economic Impact Analysis, MUSC (SC)

Douglas County Comprehensive Plan Update & Industrial/Commercial Lands Assessment, Anchor QEA and Douglas County (WA)

Chelan Comprehensive Plan Updates and Land Capacity Analysis, Anchor QEA and City of Chelan (WA)

Myrtle Beach Benchmarking, Project Grand Strand and Aha! Advisors, Myrtle Beach (SC)

Columbus Housing Needs & Supply Study, City of Columbus (NE)

FFA Strategic Plan Environmental Need Scan, National FFA Organization & Schunk Moreland Strategies

City of Cheney Comprehensive Plan, City of Cheney Planning Department (WA) & Nexus Planning Services

Ketchikan Indian Community Comprehensive Economic Development Strategy (CEDS), Ketchikan Indian Community (AK)

Places We've Been This Month

Myrtle Beach, SC

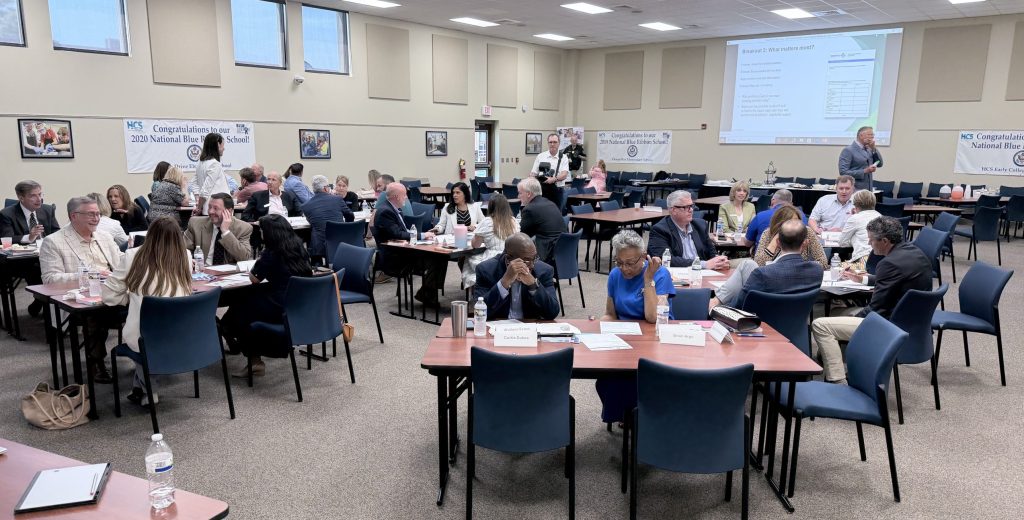
Together with our partner, Aha! Advisors, Brian visited Myrtle Beach to attend a number of community meetings as we assist with benchmarking for Project Grand Strand’s Collaborate 2031 Community Strategic Plan.

Hood River, OR

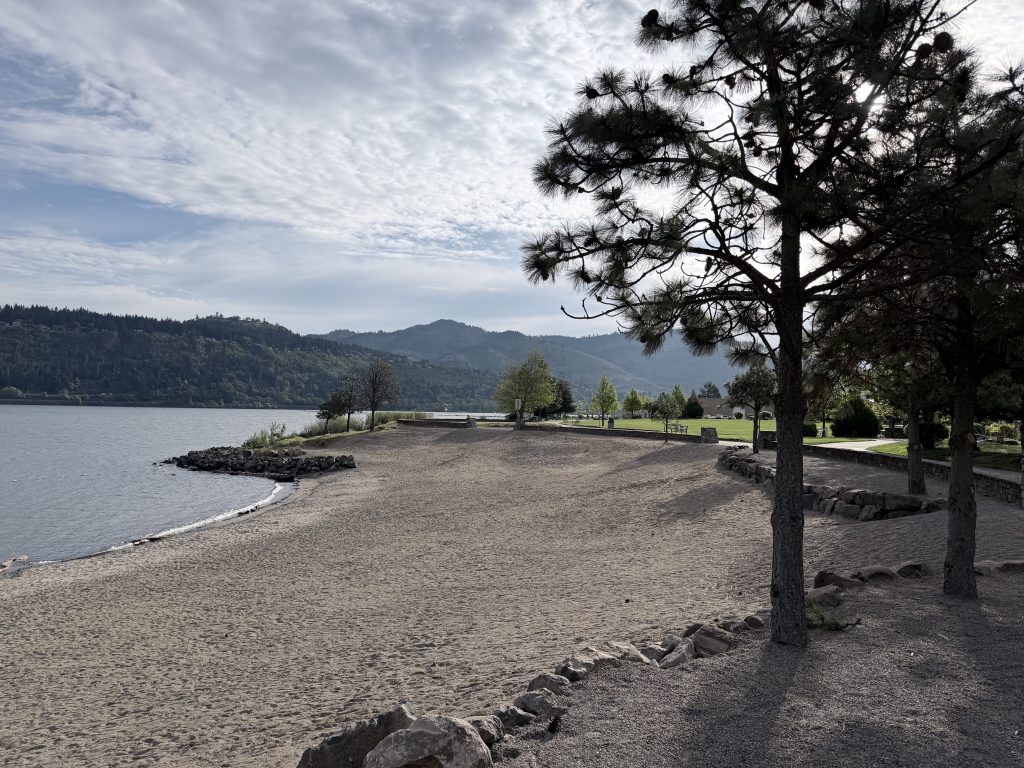
PC visited the Oregon coast to connect with Port commissioners, conduct interviews, and tour Port properties for our Port of Hood River Strategic Business Plan project. Brian also enjoyed a peaceful spring hike on the Hood River Waterfront Trail.

Boise, ID

Brian attended the Idaho Economic Development Association (IEDA) Conference in Boise, ID. Highlights included details on Opportunity Zones 2.0 and Idaho’s strategy for Foreign Direct Investment. The agenda also boasted a pre-conference tour of the Idaho Capitol and the newly renovated offices for the Department of Commerce.


Bisbee, AZ

Carson and Robyn visited Bisbee, AZ to conduct a focus group with seniors in the community. During the focus group, they discussed the potential demand for a continuing care retirement community (CCRC) in the area. They also met with some local medical professionals to discuss trends they are seeing in the area.


East Wenatchee, WA

Our team met with our partners at Anchor QEA in East Wenatchee to conduct a workshop clarifying aspects of Douglas County’s upcoming Comprehensive Plan. During the workshop, we discussed various planning efforts introduced in the County with local leadership.

Chicago, IL

Since 1989, Strategic Coach has delivered hundreds of growth strategies to over 25,000 entrepreneurs from 60+ industries worldwide. As a Strategic Coach member, Brian recently attended an entrepreneur coaching workshop in Chicago.