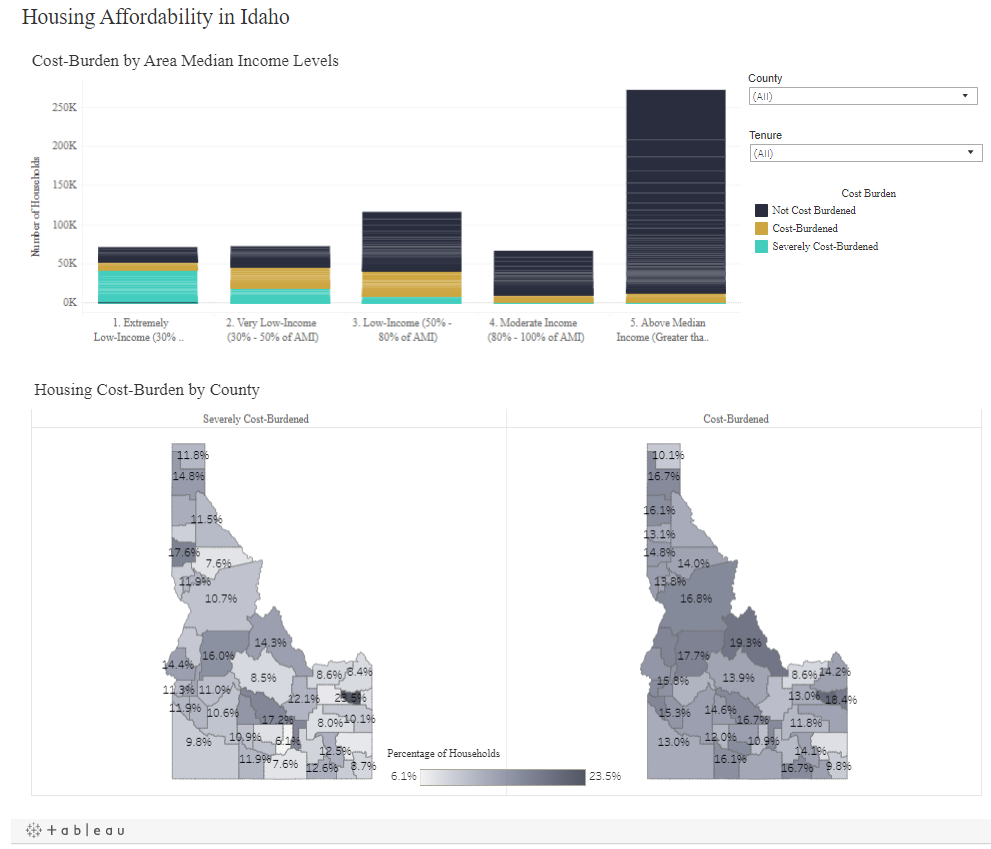
Idaho Housing Affordability Data Tool
Hi All:
I just finished developing a Tableau visualization that demonstrates housing affordability for each county in Idaho. For those not familiar with data from Housing & Urban Development (HUD), they parcel out the population by “area median income.” This allows us to more easily see what segments of the population are hit hardest by housing costs. Another important factor is tenure (i.e.: whether the resident is an owner or a renter).
Go ahead and play around, enjoy, and use it in your conversations about housing affordability in your communities.

